Thursday, December 15, 2011

Productivity in writing, and otherwise

I just read a wonderful post by writer Rachel Aaron (whom I haven't read anything by) about how she boosted her writing from 2000 words per day to over 10000. Yes, that is right, the equivalent of two articles per day. However, she is a novelist, not a scientist. What she suggests is that if you just try to make sure you have three things in place before you actually start writing, you can be much more productive.

Those things are:

  1. Know what you are going to write.
  2. Track how much you are writing.
  3. Get excited about what you are writing.
Sounds pretty straight forward. Number one is easy, there is a way you are supposed to write your articles. It is known as the IMRAD-format:
ntroduction
ethods
esults
A well kept secret
iscussion
Each of the sections have fairly well established patterns. Like the introduction:
Sentence describing a public ill. Sentence tying said ill to something vaguely connected with present study. Sentence about how present study is novel and interesting. 
New paragraph describing the actual background of the study. 
A paragraph describing what has actually been done. 
Final paragraph stating the aim and hypothesis of the study in a way that fits with the conclusion without giving it away.
The second point is more difficult. The end result of a day's writing may be a section of an article, say the abstract, that is 250 words. But in actuality you have probably written more like 1000 words, and thrown most of them away. So, given the word-limits of scientific articles, how do you track how much work you get done?

The third point is easy the first time, but then you re-write, submit, get refused, re-write, submit, get a revision, re-write, re-submit, get refused, rewrite... At some point here you aren't so excited anymore, and that is when you pick a bottom-line journal and submit one last time suggesting your best friends as reviewers.

 The strategy is also applicable to lab-work, teaching  and many other things.

  1. Know what you are going to do in the lab.
  2. Track how much you are getting done.
  3. Get excited about the work you do.
Anyway, I think her post is more well-written. You should read it.

Sunday, December 11, 2011

How many hits do you want?

Data mining is a huge business today and also an area of intense investigation. After an intense week of trying to compare gene-expressionmicroarray data from different experiments during my recent spout in Glasgow, I thought I would share some thoughts on analysis methods. Basically the choice comes down to the number of hits you might want, which in-turn is decided by how you intend to analyse and validate your results.

With modern high-throughput methods one of the main problems is choosing candidates for validation and further study. As long as you are just doing PCRs for validation, you can run quite a number, but proper validation will often require knock-out, and/or knock-in experiments, possibly both in-vivo and in-vitro. Picking the wrong candidate can cost you years of work. So, you had better be correct when you make your decision. This is a reason that it is common to filter high-throughput data by the size of change. Whether that is advisable depends on what you want to do with the data. Modern high-level data analysis often works much better if you have more to work with. Not to mention that many of the new methods of analysis are designed to look for systems of changes, each of which may be negligible, that together may cause significant physiological effects.

The calculation of a p-value comes in two steps. First you calculate a value and then you correct that value for multiple comparisons.
  • Anova: Mathematically elegant but computationally heavy and quite strict, producing not so many significant hits. It also depends on there being similar variations and similar number of samples per group.
  • Rank product: Basically ranks each gene in each sample multiply these across samples and compares the results to similar products from randomly generated datasets. Of all the heavy methods this is one of the heavier. i.e. long computations times.
  • Empirical Bayesian methods: I won't say I understand what exactly this does, but it is described as "reducing the standard error toward a common mean." This means that you are in the end comparing the estimates of the means of your samples, i.e. a variant of Student's T-test, but one that somehow takes the rest of your expression data into account. This is a quick method that is also well regarded.
  • T-test: Your favourite statistical test, seldom used by itself in microarrays, se SAM for more details.
  • SAM: Significance Analysis of Microarrays, using T-tests to test the contrast of interest and compare it to other permutations of the samples. If the contrast of interest shows a better significance (by a set level) than the random configurations then it is deemed significant. Depending on the number of permutations you use the analysis is more or less computationally heavy, but it does by necessity take quite a bit of processing.
  • Signal to noise ratio: You basically divide the the mean (difference in mean) by the standard deviation. This in itself does not produce a P-value, but it does provide a way to rank genes that can be used to pick the most probably changed genes. If you compare the list you get to lists produced by random permutations of your data, then you can produce proper p-values, but that makes it more onerous.
Once you have your p-values, they have to be corrected for the number of comparisons. The thing is that if you use a probability of chance difference cut-off of 5%, as is common, fully 1/20th of your significant genes are probably false-positives.

When correcting your p-values the first important distinction (that many are not aware of) is post-hoc versus à-priori. Mostly these relate to how to test samples after an ANOVA. Post-hoc testing means that you do not know which comparisons you want to make, so you just make them all. 
For example: You want to assess the effect of a treatment on two populations, say men and women. 
This gives rise to four groups: untreated-men, treated-men, untreated-women and treated-women. Or, you may even have before and after measurements in each of these, giving you eight groups. Between four groups there are six (x*(x-1)/2) possible comparisons, and between eight groups there are 28. If you correct your p-value for all these you may introduce a lot of false-negative results, i.e. expression changes that really are there, but that does not make your corrected cut-off. However, many of these comparisons may be nonsensical.

The difference between untreated-men-before-treatment to treated-women-after-treatment, could be one such example. It is difficult to interpret without knowing what the baseline for the women was. What you can do in this kind of situation is decide à-priori (eng. beforehand) to only run some of the comparisons. 
For example: You compare men to women before treatment, before and after treatment only in the same group, the change between before and after only within each sex, and the difference between the changes in the treated and untreated men to the same difference in women*.
This is only eight comparisons out of the possible 28, and some of these would not be included in the 28 at all, i.e. the differences. By cutting the number of comparisons you also cut the correction you have to make to your p-values. In addition, you can argue that the absolute differences are independent from the change caused by treatment and correct these comparisons separately, giving you only a four-fold correction to your p-value instead of a 28-fold. 

Anyway, that was only corrections between groups for one parameter. In a typical microarray experiment you will have 20000 parameters across your groups, so that the total number of comparisons would be 28*20000, or a lot.

Just multiplying your p-values by the number of comparisons was the original and most conservative correction. It is called Bonferroni, because that's the guy who described it. This is generally too conservative and will produce false-negatives even in experiments with a small number of comparisons. However, it is useful for narrowing the number of hits if you think you have too many, or if you need to be really certain of the hits you pick.

The family-wise error rate correction is what ANOVA uses across all samples and it is what post-hoc tests like Tukey's honest significant difference uses for post-hoc testing between individual samples. It is quite strict in large, relatively low signal-to-noise data, like microarrays, but quite relaxed in smaller data-sets. This is difficult to use in à-priori-type designs since these make the estimation of the family-wise variation difficult.

False discovery rate, or FDR, is an iterative correction across a ranked list. Basically, the first hit is uncorrected, the second somewhat corrected and so on. What it is actually saying is that; out of all the genes, from the top of the list to the point you are looking at, a given percentage will be false discoveries. So if you get 3000 with an FDR <0.05 you have 5% or 150 false positives in that sample. This is one of the least strict corrections. It is often used in microarray analysis for that very reason.

The final question is if you correct your FDR values by the number of group-wise comparisons you are doing. Or, maybe you are comparing similar, but independent, experiments, which you could argue strengthens your p-values by as much as p1*p2.

As they say: If it was easy, anyone could do it.

* in this kind of design you should really use a multi-way ANOVA instead of a plain one, and that choice often makes it obvious that you should use à-priori contrasts instead of a post-hoc.

Thursday, November 17, 2011

Shopping in Glasgow

While my trusted side-kick is off on some well deserved shopping I decided to try blogging from the iPhone. It does not seem impossible, although I get to correct myself a lot.

I'm not going to write about shopping in Glasgow, but I am going to mention that the very small Mexican take-out west of the Glasgow Uni is amazingly good. Best fajita east of San Diego as far as I am concerned.

Now, I guess I will have to return to the Uni for the afternoon analysis session.

Monday, November 14, 2011

Traveling noob

I am back in Glasgow, in the same hotel room as last time. It was still cheap, and still quite nice.

Just as with Bergen, it is close to the end of the world. Instead of flying directly, you can choose between Copenhagen, London and Amsterdam; or a combination. This time it was Amsterdam and a five-hour flight and transfer time.

Travelling with an orthosis is really quite alright. Security suddely treats you like a porcelain doll, and everyone is most helpful. It does, however, make it more difficult to manage the transfer when you are 30 minutes late because of fog.

Anyway. Now I must sleep, it's been a 19-hour day. 12 of them actually working. I just hope the rest of the week will be as productive. Might be once I get a new adapter so that I can charge the computer. Noob.


- Posted using BlogPress from my iPad

Location:

Thursday, November 10, 2011

Understanding Criticism

Critique (also known as peer-review) is an integral part of science. You can handle it in two ways. Either you do it the Nazi-way, or in a more civilised way. Alain Briot is a renown landscape photographer who has written several (that's 1, 2, several) books about working as a photographer. In addition he quite regularly writes for Luminous Landscape, one of the premier photography sites in the world. Recently they published his essay "Understanding Criticism", which is what inspired me to write this little blog-post. It is actually a trilogy: Understanding Criticism, Responding to Criticism and the up-coming just published: Staying Motivated, which changed title to "A few words on perseverance."

I think you should read them. Below is just the alternative introduction, so that it is more about science than art. Where criticism in the arts is often a matter of taste and happens after the art as such is finished, criticism is an integral part of the scientific method. Without critique there would be no science.

Alain writes that: "It is the nature of art that we do not all agree on what is art." This is not true about science. There are some easy criteria by which any work or statement can be judged as scientific or not. I think the easiest test is whether it opens up for more research or not. If it purports to be a final answer, then it is probably hyperbole. However, there are still differences of opinion regarding the quality and importance of different areas of science from different perspectives. The to big divides are the natural sciences versus the humanities, and basic versus applied science. These can give rise to unwarranted criticism, although they can also give rise to very interesting questions. Scientific criticism basically involves four valid targets.
  • The rationale.
  • The methods.
  • The conclusions.
  • The presentation.
Note that I do not include criticism of the data as such, because data is inviolable as long as the methods are sound. When receiving criticism it is very important to decide which of the targets are actually under fire. For example: When they attack your rationale, it is often because the presentation of said rationale is weak and difficult to understand.

Finally, there is the unscientific criticism, which I will leave for now. I have to prepare to go to Glasgow to write a new and exciting paper so that I can send it in for organised criticism by highly trained terriers esteemed colleagues. But, seriously read the series.

Monday, October 24, 2011

Illustrating on the iPad

Yes, it is white with a pink cover, and I put it on the boxer.
I finally caved in, or rather my better half did. Now I have an iPad (Ho, Ho, Ho). It's not a machine-gun but affords some other, equally amazing, possibilities, you can surf in bed, surf in cafes, and you can even surf on the loo. Amazing, I say! What I really want it for is drawing. For research-articles there is seldom any real use for drawing, but when writing reviews, presentations, and when teaching, it is indispensable.

Different lecturers and teachers have different approaches, and different students require different teaching strategies, but everything gets better with good pictures. For review-articles and formal presentations you need high quality illustrations, while for teaching I find it better to draw live, so that the students can follow along. There is of course some middle-ground, students that need original data and high-quality illustrations that they get hand-outs of, and formal presentations that can include free-hand drawing.

Anyway, these two ways of working need somewhat different programs, or Apps, as I have understood they are called. Before we start drawing however, one does need an implement. I got the stylish aluminium stylus from "Just | mobile". It has a solid feel, looks stylish (oh, no I said it again), and... well that's it really.

Now, to the actual drawing. Let's start with free-hand drawing that you can use just to show things. There is a multitude of simple drawing programs for the iPad, and you can also use a more advanced application for your quick sketching. The one I got was Bamboo Paper from Wacom (that otherwise makes professional digitisers).

It has three features I like,

1: It organises drawings by notebooks. That means that all drawings and notes from one lecture is automatically connected. They can even be exported directly as a multi-page PDF for use as hand-outs.

2: When connected to an external screen it just shows the drawing area. The controls are only visible on the iPad.

3: The interface is really simple. You can draw, erase and undo/redo. Then pen has three different settings for line thickness and six colours (well, actually three since half the colours are shades of blue).

Let us turn to real drawing and the creation of publication quality illustrations. For this you need two things: a sketching program and a line-art/vector program. The first is necessary because that's how you, or at least I, develop and refine the concept. The second is what constitutes "publication quality", i.e. freely scalable line-drawings that can be output as EPS or PDF, depending on your publisher.

I found two programs for each function with slightly different capabilities. For sketching I got SketchBook from AutoDesk (the maker of AutoCad) and ArtRage. These are two very different programs. Artrage was created to simulate working with real media. You have a wide choice of paper and canvas variants (and can change after the fact), and an equally wide range of simulated media; from   pencil to oil, water-colour and inks. The amazing thing with it is that it simulates how these media behave in the real world. Oil-colour mixes on the canvas, and water-colour bleeds.

Three examples from Artrage, oil and water-colour with photographs as originals, and a pencil sketch of Madicken sleeping in the office chair.

As a bonus it has a well designed ability to work with layers so you can put the sketch, background colour fields and shadows & highlights on different layers and work with them independently. It even has a special layer for a photograph or some other image you want to use as basis for your work of art. The interface is very clean, and at the same time powerful. There is a implement selector in the left corner and a palette in the right, if you leave them open they are single click interfaces. To say that I am happy with Artrage would be an understatement. It is an achievement in programming and design. I may never use paper again.

SketchBook is more of an honest computer drawing-program and has all the usual things, pencil, brush, air brush and so on, but it doesn't try to be oil on canvas. The interface is very clean and the most important things can be controlled with gestures (pencil type and colour, layer and undo/redo), but otherwise it is a two- to four-click interface. In my hands it is a lot like drawing with ink on paper. Not for absolute scale-drawing, but good for illustration purposes.

Quick concept for the two kidney, one clip model of renal hypertension made in SketchBook. I used three layers, one for the sketch, one for colouring, and one for shadows.
Something like that may be good enough, or we may want something a bit more stylised for publication. In that case we can use the sketch as a basis for a vector-based drawing. I got two programs rumored to be the best vector-Apps on the iPad: iDesign and Inkpad. iDesign is supposedly the more competent of the two, allowing true cad-like features like absolute scaling, and exact positioning and angling by numbers. However, it took me over a minute to find the undo-button. That's when I quit and tried Inkpad instead. There will be no review of iDesign at this time.

Addendum: I figured out how iDesign works. I had to make a more exact graph-like illustration, and Inkpad turned out to be completely useless since it just doesn't handle that level och precision. Even the undo/redo button was much easier to find once I figured out how the interface works. There are four extendable tool-strips, one per side, with all the frequently used commands and tools. There is a snapping-grid that increases in exactness with zoom, and can be set to scale. Each point and line can be exactly positioned by number: X, Y, height, width and rotation. Colour gradients are not as easy as in Inkpad (i.e. I cannot find it). In summary it is a CAD application on the iPad, and as such it makes you work in a more precise manner.
Inkpad just worked for me. The interface is completely self-explanatory. It does not have that many functions, you can basically draw paths and fill them. In addition filling with gradients is as easy and versatile as I have ever seen it done, simply marvelous. It is also easy to import one, or more, pictures to use as originals. Most importantly the undo and redo buttons are immediately obvious at the bottom of the page.

Using the previous image as original it took me about 20 minutes to create this scalable version with smooth lines and even gradients in Inkpad. Looks professional, is what it does. It also has no personality, but that is what is expected from scientific illustrations.
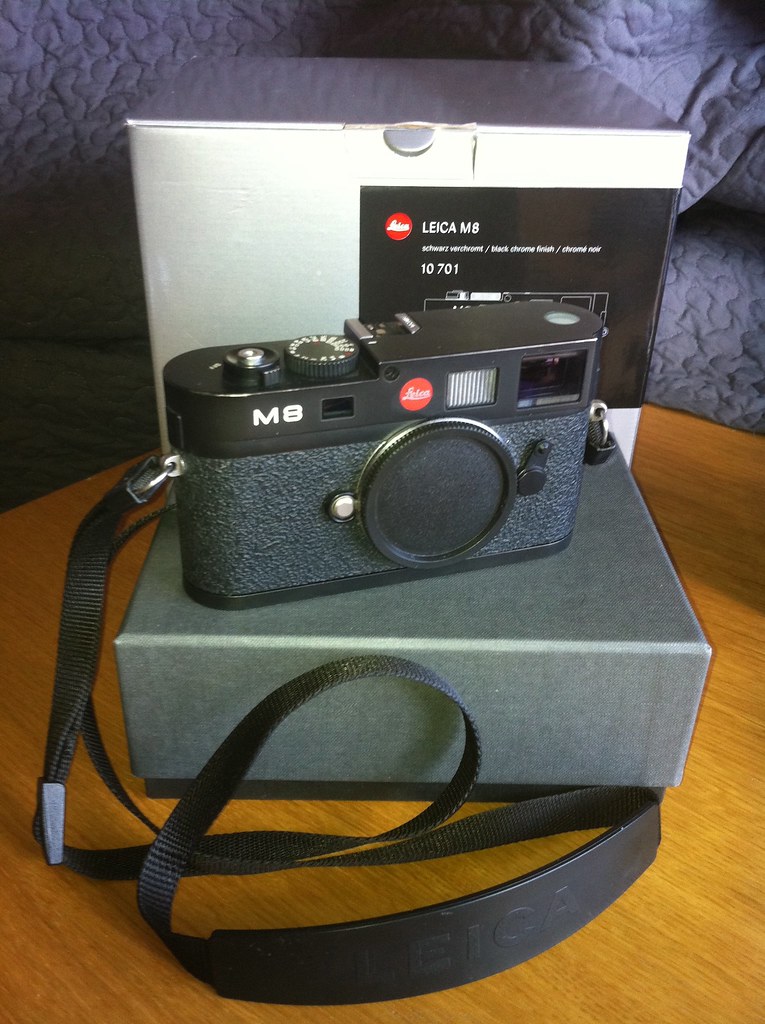
Although I have done mostly photography the last couple of years, drawing and painting were my original passions. In a fortuitous turn of events the sale of my camera allowed me to return to the original fold, with new and improved tools. The down side is that the quality of the photographs has degraded significantly.

Sunday, October 16, 2011

Pain and morphine

The ligaments and the joint capsule are very well innervated structures. That is why it hurt so much when you rip them asunder, and, apparently, after you stitch them back together. Pain, as you know, is just weakness leaving the body, and drugs make you strong. Strong drugs makes you stronger.

It is now three weeks since I ruptured my medial collateral ligament, and anterior cruciate ligament of the left knee. The ligaments are not only well innervated, they are also well endowed with blood vessels. So, after the injury my knee promptly filled up with blood. When the blood cells die and break up they release a huge amount of proteins into the joint and this will attract even more fluid by osmosis. Three days after the injury my knee was so full it was all but immobilised, and it looked more like a melon than any part of a human being. Sadly, I did not have the wherewithal to take a picture either before or during the draining of the joint. That was the first use of strong drugs, or derivatives of strong drugs anyway.

The local anaesthetic Xylocain has the innocuous ending -cain because it is derived from Cocaine. Cocaine is a brilliant local anaesthetic, which is still used in Ear-Nose-Throat surgery, but otherwise it has been superseded by variants that do not give you as much of a high. After a little dose of Xylocain, you can take a 0.8 mm needle (or thicker if you wish) in your knee without flinching.

While the acute pain was rather intense, the following week was not worse than that I could get along with only ibuprofen and paracetamol. Then I let the surgeons at my knee. That gave me the opportunity to test another drug: Propofol. It is what Michael Jackson used to sleep on, which is like killing a mosquito with a nuclear bomb. Anyway, propofol makes you sleep like a baby. The surgeons stitched up my collateral ligament and after that the real pain started, and then it disappeared. I woke up after surgery, quite groggy. A moment later I noticed that my knee hurt, and one of the nurses asked if it hurt, I said yes and they gave me morphine.

Morphine takes the pain away. It is quite amazing, where one minute you have an intense, penetrating pain that makes it impossible to think, the next minute it is just gone. At the same time it does not affect your faculties so much, at least not at the doses I have tried. Where local anaesthetics are just inhibiting the nerve transmission at the exact site where you give it, and narcosis basically makes you sleep so that you don't experience the pain, opiates directly affect the activation of the pain nerves. And only the pain nerves (well mostly).

It binds to special morphine receptors (well they are really endorphin receptors, but I always thought it was amazing that the body had receptors for drugs. That was until I realised that it was the other way around: That drugs are things we have receptors for). These morphine receptors can be found both on peripheral nerves, in the spinal cord and in the brain. At all these levels they lessen the feeling of pain. So, the painful stimulus elicits a weaker signal in your peripheral pain nerves. Then the pain nerve enters the spinal cord through the dorsal root and synapses to another pain nerve which runs up the anterolateral system of the spinal cord to the spinothalamic tract of the brain stem and then into the brain. In the spinal cord there are descending pain moderating nerves that release endorphins and makes you less sensitive to pain when you don't have the time to bother with it. It for example you are fleeing from a crocodile, or playing judo. Morphine activates the same receptors. They are also present in the brain where the sensation of pain is actually created, here their activation increases your pain threshold.

Morphine only has two draw backs: 1: It is addictive as hell, and 2: It is excreted through the kidneys, which makes it inappropriate for patients with acute or chronic kidney disease (I have heard something about opiates and breathing, the GI-tract, nausia but I never understood exactly how it involves the kidneys). The problem with addictiveness was realised hundreds, if not thousands of years ago. It was not morphine then, it was opium. Interestingly, at the turn of the last century heroin was thought to be a milder, non-addictive version of morphine. It was used as cough-syrop and even used to treat morphine and opium addiction. To say that it was a little embarrassing for Bayer when it was shown to be a faster acting, even more addictive, version of morphine, is probably true.

The addictiveness of opiates depends on three things: 1: Tolerance, or down regulation of receptor mediated signaling due to receptor activation, 2: You get high, 3: You get abstinent.

The problem for patients with kidney disease is that morphine is usually metabolised by glucuronidation  which makes it more water soluble and then it is excreted by the kidneys. Reduced kidney function increases the risk of toxicity. Luckily, my kidneys work just fine.

If you want some more reading Pubmed is good for all that boring stuff, but for your literary side I have some suggestions: Confessions of an English Opium Eater by Thomas De Quincey, available for free through the Gutenberg project. The always nice The Adventures of Sherlock Holmes by Sir Arthur Conan Doyle is a well known book with a cocaine addicted hero. I don't know of any classic literature involving NSAIDs or general anaesthesia. On the other hand pain features prominently in practically all books, it is called into action to shape and destroy characters. It is the reason they rise above their peers, and the reason they fall. The great heroes of literature (and film) overcome great pain, thus showing that all weakness has left them. Then they alone can stand up to the evil that previously was threatening the whole world.

Ok, so literature and film is not the best place to find realism, but with music and special effects it makes the days go by when your physiotherapist says you should not put too much strain the knee after surgery, even though morphine takes the pain away.

Saturday, October 15, 2011

Rise and fall of a photographer


I am selling my beloved Leica M8. The reason is that I never use it anymore. With never I mean less then once a month this year, and that is not enough to warrant the equipment. I did photography during primary and secondary school, proper film photography, even did some darkroom work. I used my fathers cameras. The Canon Canonet QL17 when he got the Canon AE1. Then the AE1 when he bought the Canon EOS5. I shot mostly birds and pretty views. During secondary school I did less and less of that and then I went to university and didn't do any photography for years.
Canon AE1 with 50mm f/1.9 standard lens. In the users guide it is presented as the worlds first whole automatic, electronic camera. That is, it had both aperture and shutter priority, and could use them at the same time in the full-auto mode. It still used film, had a manual film-advance lever and had manual focus. It was a wonderful camera.
In 2007 my mother arranged a safari in Kenya. It was obvious that I would need a good camera and that I would need time to learn how to use it again. I quickly bought some film (hard to get in 2007) and got the old AE1 out and put on the 400mm lens and tried to photograph the bird in my garden. It didn't go so well. After perusing the photography sites and forums, as any nerd would, I decided to get a Canon EOS 1D. It was then a six-year-old design, but it had been the first real professional digital camera for sport and wild-life. On the used market is was just on the way out, but those you could get were quite cheap. To top that off I bought a used Sigma 300mm f/2.8.
Canon EOS 1D the 2001 flag-ship digital SLR with a Sigma 300mm f/2.8.
4.1 megapixel
8 pictures / second
4kg
The trip was a huge success, and the camera was a dream to work with. These kinds of truly professional cameras are responsive and fast and built like tanks. It is just amazing to work with one, and they are obviously even better today. I filled up two 500MB memory cards every morning and every afternoon, totaling over 8000 pictures for the seven-day trip.

Lioness with cubs in the Masai Mara. On the third morning we met a pride of 17 lions just walking down the road. They walked right up to the trucks as if they owned the road and completely ignored us. Except for one that stopped to scratch an itch against our side door.
No matter how pretty the pictures were or how brilliantly the camera performed on safari, it is huge and heavy. My camera bag weighed over 15 kilograms in Africa. Once I was back in Norway this quickly became clear as I didn't get out with it much. If you go out with a four kilogram camera and a camera bag you don't bring anything else, and you would rather not walk too far. I changed to a Canon EOS 30D that was just a little bit old at that time. I bought a macro lens (as every photographer is bound to do at some point) and the macro flash (absolutely necessary) and did some macro photography (it's a phase).
Canon 30D with a 100mm f/2.8 macro and the twin-head macro flash. You can do amazing macro photography with this set up, but as it turns out so can anyone else.

Fly on flower photographed with the setup above. Search for "fly flower macro" on flickr and you will find another million pictures just like it.
Then I sold the lot, and bought an Epson R-D1. At the time a truly unique camera. It was the first digital rangefinder camera and it a Leica M lens mount. I used it incessantly for half a year.
Epson R-D1 digital rangefinder camera with a 21mm f/4 Voigtländer color-skopar lens and an external viewfinder.
Around that time I also found the fantastic Strobist blog and started doing proper flash photography with my newly acquired strobist kit. The idea is to use off camera flash instead of relying on natural light (which may be fickle) or on camera flash (which looks like shite). My poor boxer dog became quite good at posing.
Strobist kit of three flashes with radio triggers, stands and umbrellas around a bored boxer.
Bored boxer.
About half a year later I sold the R-D1 and bought the Leica M8, which I am now selling. However, before the present state of disuse, I used it quite a lot. Strobist fashion for portraits and I did street photography (which is kind of like photo-journalism but without being a journalist or going to a war-zone), and less pretentiously I photographed dogs. Lots and lots of dogs.
Dogs at play in Langeskogen in Bergen, Norway.
Some time later I got my first photo printer and started trying to print some high-quality photographs since it was difficult and expensive to get anything decent out of the photo-labs. Learning to print was quite satisfying and took a couple of months before I could do it well enough. Now, I should be perfecting my craft and in another couple of years I might be really good, but as I wrote, my activity is declining.

I started out frantically. In the second half of 2007 I shot 68 days. Then in 2008 it was 98 days of the year. In 2009 it decreased to 70 days, and in 2010 to 39 days. So far 2011 I have only photographed 8 days, and at least two of them were completely inane things like using the camera instead of a scanner. So now I am selling my Leica equipment.
Leica M8, four lenses and some accessories.
It is a bit sad, but a decision had to be made, and with an injured leg I was bored out of my mind and really needed something to do. If you are in Sweden the advert is at Fotosidan.se and there are more pictures in my flickr photo stream. The asking price is SEK 22000, or about €2400 (Edit: Now, just a few hours after the original post, the camera is gone. I must have charged too little).

Sunday, October 09, 2011

Injury and productivity

When you cannot move you have to do something else with your time. Like work (or watch a never-ending cavalcade of youtube-clips). While I don't think it is something that holds true over the longer term, I have certainly gotten some old projects finished rather faster than I otherwise would have.


But then my physiotherapist got her claws into me, and was all like "stop being such a sap and get out and use the bloody leg". In addition, I got this pretty blue and grey orthosis that gives some much needed side stability. So now I work as much as ever. The only difference now is that I walk more slowly, peddle my bicycle in a strange one-legged way, and at the end of the day I am slightly more tired than when I had two fully functioning legs. Today I got enough movement back to use the leg for a full revolution on the bicycle.

I ask you, if it sounds like a luxury problem, looks like a luxury problem, and smells like a luxury problem. Should I still be whining?

Saturday, October 01, 2011

Hell week

Knee in compression directly after the accident. If the foot looks bloodless it is because it is.
That is the end of my try to stay breast-to-breast with the elite. My leg got caught under my partner at randori and injured the medial collateral ligament on the left knee. Afterwards I have realised that what actually happened was a double whammy. First I blocked a throw by going down on the knee and landing quite hard. I didn't think too much about that, but it was the exact same spot that buckled just a minute later.

Now I'm looking at six to eight weeks of rehab. The first week wasn't that bad, at first. Then the blood in the joint osmotically attracted so much fluid that it had to be emptied. Being uncomfortable around needles, that was a bit of a downer. I pulled 35ml of blood and fluid out of the knee and then it didn't hurt as much.

Once that was done, I had a freeze-dried yoghurt-covered strawberry and bit off a tooth. Lengthwise. I got to my dentist, who obligingly pulled out a syringe and anesthetized my hard palate, compared to which puncturing the knee joint is nothing. Then ,she found two more holes and went on to put a needle in my lingual nerve and above the front teeth on the other side. The horror of the story is that i have to go back. Both to the knee-doctor and the dentist.

Publication bias

Funnel plot from Dubben & Beck-Bornholdt showing the publication bias in publications about publication bias.

Thanks to TED and Ben Goldacre, a doctor and epidemiologist, for showing me the best graph ever in his TED-talk: Battling Bad Science. It is the publication bias of publications on publication bias (Dubben & Beck-Bornholdt, BMJ, 331, August 2005, 433-434). Amazingly it is more skewed than most similar graphs in medicine where the publication bias is often held up as the scourge of science, and can be used to put any effect of treatment in doubt.

Now let's turn to our favourite field, hypertension. First we can look at something where we don't expect there to be a difference. For example Angiotensin Receptor Blockers (ARB) compared to Angiotensin Convertin Enzyme Inhibitors (ACEi). Some additional positive effect was expected from ARBs since they only block the evil, AT1, receptor while endogenous Angiotensin II (AngII) would still be able to activate the good, AT2, receptor. Results to this effect have been found in experimental studies, and in initial observational studies. In 2008, Matchar and collaborators reported a meta analysis of head-to-head trials of ARB vs. ACEi (Matchar et al. Ann Int Med. 148 (1) January 2008, 16-29). In their forest plot you first see the observational studies, and they do favour ARBs slightly. Then follows the 19 randomized controlled trials and the average effect is squarely on the identity line, there is no difference in mortality or cardiovascular events between ARBs and ACEi.

Forest plot from adapted from Matchar et al to show publication bias.
If you want to look at publication bias for the 19 studies they have analysed, you can either make a funnel plot as the one above, or you can just re-order the forest plot by effect size. What you should then find is a distribution that looks a little bit like a Q/Q-plot. The large trials should be close to the middle, while the smaller trials should show larger variation and form the tails of the curve. If one tail was missing, then that would be evidence of publication bias.  So, at least in the studies of ARBs vs. ACEi it appears that publication bias is small, and that the reported absence of a difference in clinical out-come may be true.

In clinical medicine today, pre-publication of the protocols and end-points of all clinical trials should pretty much remove publication bias. This may be what we see in the above plot. In basic science and, let's say, publication bias publishing this may still be a problem. In basic medicine the studies are not huge, pre-planned, things that any journal would want to pre-publish. The research is in its search for mechanisms much more of a chain of findings, each building upon the previous. Just one article will often describe as many studies as one of the above meta analyses. In that way they are often more solid than your single clinical trial because the basic finding is repeated several times for each new sub-experiment. At the same time they are more prone to bias by the research group, lab and model. That is, experimental studies should not be generalized outside of the lab where the experiments were performed or the model they were performed in unless you re-do them in another lab with another model. And then, they are true in two models and labs.

Saturday, September 24, 2011

Comparative physiology of aerobic scope


When surfing around looking for data on VO2max I found some interesting comparisons.

First we can have a look at different sports, you may remember that elite judo athletes had a maximal VO2 at around 60 ml/(min*kg). I guess most readers will have heard about the extremes of aerobic capacity. Who the best is depends on the unit used. Cross country skiers are the most extreme when compared to body weight. The highest ever published VO2max was Bjørn Dæhli, world champion from Norway. He had a VO2max over 90 ml/(min*kg), I have seen anything up to 96 ml/(min*kg), but cannot find the original publication.

If we ignore body weight, olympic rowers are reported with the highest oxygen consumption among athletes, but they can afford to be more massive than many other athletes and therefore get lower maximal uptake when related to body weight.


Then we can look at the real comparative physiology of endurance. Reported maximal oxygen consumption VO2max in running animals are quite a bit more impressive than humans. Note that these are extremes from non-original publications.

Human: 96 ml/(min*kg)
Horse, thoroughbred: 160 ml/(min*kg)
Dog, sledhound: 240 ml/(min*kg)

So, that's why I can run for an hour with my boxer, and when I am all done she wants to play fetch. For another hour.


Even more interesting than maximal aerobic capacity is the concept of aerobic scope. That is the difference between the rate of oxygen consumption at resting metabolic rate and at maximal aerobic exertion, i.e. VO2max.

Oxygen consumption at rest from original publications:

Human: 7.8 ml/(min*kg) (J Hum Kin vol 6, 2001, Andziulus et al)
Horse: 7.2 ml/(min*kg) (Am J Physiol vol 253, 1987, Weber et al)
Dog: 7.8 ml/(min*kg) (J Appl Physiol vol 19, 1961, Bailie et al)

This gives an aerobic scope of about 10 times in human endurance athletes, 20 times in racing horses and a whopping 30 times in racing dogs. This is not what is generally reported as aerobic scope because it is usually based on basal metabolic rate, which is a theoretical entity measured after sleep and fasting at a high ambient temperature. And, it is compared to popularly reported maxima for the different species. If you look at scaling and metabolic scope there are better articles with reproducible methods and averaged maxima e.g. Charles Bishop, Proc. R. Soc. Lond. B (1999) 266, 2275-2281.

In addition to being interesting, I am pretty satisfied to have combined science, dogs and photography in one post. 

Monday, August 29, 2011

SPS 2011 in Bergen

The annual meeting of the Scandinavian Physiological Society was held August 12-14. The difficulty of trying to combine working as a junior doctor with active research made itself evident by my trying to fly in the same morning. Since the airlines still believed it was summer, there were no direct flights. So I had to board at 05:40 in the morning in order to arrive in Bergen at 09:30 after a brief stop in Copenhagen. Yes, Copenhagen. That is 1217 km instead of 703 km according to Google Maps.


Anyway, that meant I missed the opening lectures. As far as I have heard they were brilliant. Polly Maltzinger talked about "Conversations between tissues and the immune system" and then Roger Seymour talked about "Homage to Scholander, Johansen and Schmidt-Nielsen: Ecophysiology of temperature regulation and energetics".

The most interesting presentation that I actually attended was Jens Titze's about how macrophages in the skin affect sodium balance and blood pressure. Apparently this happens completely without involving the kidneys. If you, like I, have a hard time grasping the idea you can read more in his Nature Medicine paper: "Macrophages regulate salt-dependent volume and blood pressure by a vascular endothelial growth factor-C-dependent buffering mechanism" (Machnik et al. Nat Med. 2009 May;15(5):545-52). The future developments in this field will be very interesting.

The social program was outstanding. The young investigators party included a free bar (Yay!) and a live band. Although they played a bit too loud for relaxed conversations, the lubrication was enough to get even young, more or less autistic, researchers to socialise and meet new people. Saturday evening there was the conference dinner, which was held at the top of mount Fløyen. The resturant managed to produce very nice, quite authentic Norwegian food, and similarly very good entertainment with some authentic Norwegian parts.

All in all, a very successful meeting. Thanks to the organisers in Bergen and the SPS for making it happen.

Sunday, August 21, 2011

Bjarne Magnus Iversen (1942-03-30 - 2011-08-05)


My very good friend and mentor Bjarne Magnus Iversen died the night to august 5th. He was born in March 1942 and became 69 years old. At the time of his death he was on a fishing trip with friends, one of whom found him dead in bed on Friday morning. The death was sudden and unexpected, but peaceful. He was in no way ready to leave us, but if he would have had a choice I am certain he would have liked nothing better than to die while fishing.
Bjarne was known for his modesty and great ability to make friends. He would describe him self as “just a fisherman from the fjords.” Everyone who had the benefit of meeting Bjarne got the feeling that he really cared about him or her and their lives. This was an ability that he used to great effect in his work as a physician, as a scientist and as an administrator. As outlined in any of the more formal obituaries he achieved much in his life and left us at the absolute peak of his career.
He was an avid fisherman and would never miss a chance to send pictures of his latest catch to everyone he knew. I used to take him hunting in Sweden, where he availed himself to several fine trophies and even better dinners of Swedish roe deer. A dream of his was to hunt moose, and although we did on one or two occasions he never got the chance to fell one. Our plans to rectify this in the autumn will now forever go unfulfilled.
Bjarne had the indomitable spirit to go from failure to failure without loosing enthusiasm for the project at hand, or loosing sight of the goal. As my thesis advisor and mentor this was his greatest asset. We will try to go on in his spirit and attack each new challenge with undiminished zeal.

Friday, July 29, 2011

Aerobic endurance

Today's post is about endurance. Physiologically, endurance is about energy delivery. In many ways the muscles are machines that can keep up a given amount of work for as long as there is sufficient energy. Chemically, fuel and oxygen is converted to carbon dioxide and water, which releases energy. This is the same thing that happens in a fire, but since we don't want to burn up, the energy release is very closely controlled by the use of the energy currency: adenosine triphosphate (ATP).

New ATP is produced through three basic mechanisms: nonaerobic metabolism, anaerobic metabolism and aerobic metabolism. The mechansims are listed in order of speed, that is the rate at which they can replenish ATP, which corresponds to the maximal level of effort that can be sustained by them.

Nonaerobic metabolism is the conversion adenosine diphosphate (ADP, with two phosphate groups), into ATP using creatine phosphate (CP). This is very fast and provides almost all energy the first 8-10 seconds of any exercise, and can produce around 1200 watt (Guyton & Hall, 10th ed.). It is limited by the intracellular stores of CP, which aren't that large.

Anaerobic metabolism is the breakdown of glucose or glycogen into lactic acid. The process is very fast, producing about 650 watt and can keep going for much longer than the CP-ATP conversion. However, it is limited by the acidity of lactate. All enzymes, including actin and myosin and the metabolic enzymes, have an optimal pH. When the pH varies from this they get less effective, and after about 60 seconds of pure anaerobic exercise the muscle pH will be far enough below the ideal for the process to be severely impaired and the muscle becomes fatigued. In judo, the combination of these first two kinds of metabolism is what provides energy during the intense parts of the workout.

Finally there is aerobic metabolism where glucose/glycogen, proteins, fat or lactate can be used to produce ATP through the Kreb's cycle, which requires oxygen. When burning glycogen, which is the most efficient, aerobic metabolism can produce about 280 watt. In judo this is what allows us to keep going for a full two hour session, and importantly what happens between the short periods of attack and defense to keep fatigue at bay. In the low intensity periods between bouts lactate can be removed from the muscle.

So, the most important part of endurance for judo training, and thus for keeping up with young elite athletes, is the aerobic capacity. The demands aren't as strenuous as for pure endurance sports like running or swimming, but you have to be fit enough to continuously recover from fatigue for a full two hours of training. Going back to our definition of endurance as energy delivery. This means the rate of oxygen consumption, which can be measured in ml/min. In order to be able to make comparisons between different athletes this in often normalised to body weight so that the most commonly used unit is ml/(min*kg).

According to the only english-language, judo-specific book on sports science I know of: "The sport science of elite judo athletes" by Wayland Pulkkinen, the maximal rate of oxygen uptake, or VO2max (that's "V" with a dot over it indicating volume over time, "O" with a "2" subscript as in oxygen, and max, as in max.), of judoka is around 60 ml/(min*kg).

The question then is: How do I measure up? To find out we have to find a way to measure VO2max, but actually measuring VO2max is impractical outside of a physiology laboratory. What remains is estimation from parameters we can easily measure. There are a number of more or less well validated methods to estimate VO2max. You can find them through your friendly, neighbourhood search engine (PubMed, not Google). Uth and co-workers presented their method in 2004 (Eur J Appl Physiol, 91(1), 111-115), so fairly recently, and they used well-trained men aged 21-51 years old by running while measuring their pulse.

The method by Uth et al calls for a resting heart rate, which I found to be about 50/min and a maximal heart rate which I found to be about 200/min. You then divide your maximum heart rate by your minimum heart rate and multiply by 15.3, let's say 15. That gives:
200 / 50 * 15 = 60 ml/(min*kg)
In conclusion, I can not blame my aerobic capacity for any of my shortcomings, but I did find out that I need to work on my running. My calves are killing me.

Fitness for judo

Physical fitness is a complex parameter that is not easily caught in any one number. As any role-playing gamer knows, there are three basic physical characteristics: constitution (CON), strength (STR) and dexterity (DEX).

In addition, judo competition is divided by weight categories so that each of the stats have to be optimised in relation to body weight. Some judoka have, apparently, rolled the perfect 18, 18, 18 and can beat everyone, but the rest of us will have to do with stats that aren't as stellar, and hopefully, bodies (and opponents) that aren't quite as large.

CON:
In judo constitution, or endurance, means that you have to be able to do two things: Control your opponent for at least five minutes, and launch your own attacks. The former is an inherently aerobic task because of it's length, but it is broken into shorter intervals by all sorts of breaks. At the same time the latter is anaerobic on the verge of nonaerobic. That is, during a match you use enormous amounts of energy very quickly, when attacking or defending, and then you have to re-coup this oxygen debt time and time again in the lulls of the fight.

STR:
For any given technical level, the stronger judoka always wins. The easiest way to get stronger is to increase muscle size, this increases the number of motor units and makes you stronger. It also makes you heavier. That's the reason for weight categories. Another way to become stronger is to learn how to activate as many muscle fibers as possible at the same time, while relaxing the opposing muscles as much as possible. This is an important reason for building strength using the movements that will actually be used in judo, and not only by lifting weights.

DEX:
Dexterity can be separated into speed and limberness, where speed is the most important. It is important to be limber enough to perform all techniques, but there are always techniques that require less flexibility. However, if you are faster than your opponent, he will be hard brought to avoid your attacks. Speed in judo means how quickly you can step and turn into your technique or out of your opponents. It also means how quickly you are able to notice and react to an opening in your opponent's defense. Both require very specific training, which is why years of recreational judo has surprisingly little impact on the ability to beat competitive judoka (not to mention that they have higher CON and STR as well, or do they?).

Next up will be a more detailed look at CON. How do competitive judoka perform, and how much do I have to catch up?

Wednesday, July 27, 2011

Judo!

I did include judo as something that the Nephrophysiologist blog would be about, but there hasn't been much about that. Actually, there hasn't been any judo here at all. It has been hard to find something sufficiently interesting to write about, something where I also feel I have enough to say that someone might find interesting.

So, what has changed? you might ask. My answer would be that my sights have been raised for me. As I moved home to Uppsala and changed labs and hospitals, I also changed clubs. From a small club with recent recruiting difficulties and therefore a clientele of slightly older, non-competetive judoka, to a large, competitive club with some recent successes. Anyway, while it is a lot of fun working out with the youngsters, they are in better shape than I am. It would be more fun if that wasn't the case.

To remedy the situation (so that I'm not that embarrassingly winded older guy) I started doing some supplemental training. At first I had the basic philosophy that anything is better than nothing (which is true). However, being a physiologist it's hard not to have a quick look at what the science says. The judo posts will try to handle the science of judo performance from a practical perspective as I play catch-up with elite judoka more than ten years younger than me.

Monday, July 25, 2011

Using the OS X clipboard in R

One annoyance with using a command line based statistical system, i.e. R, is that if you use a spreadsheet program to handle your data (as most of you do) you have to incessantly export to csv and import to R. For big data sheets and complex calculations this generally a Good Idea(tm). It improves reproducibility and readability when going back to the project at some later time. However, the complexity of that is enough that you often, at least I, end up doing statistics in Excel. This is generally a Bad Idea, and often entails much more work in the long run. In order to make importing and exporting data easier R can handle the clipboard directly, which is what this post is about.

In OS X the clipboard is easily accessed through the command line programs pbcopy and pbpaste (pb means "pasteboard" but everyone knows it as the clipboard so that's what I'm going to call it). These are easily scriptable programs that can be used with any unix command in the shell or scripts (enter "man pbpaste" in the terminal to learn more). "pbpaste" pastes the current clipboard to std-out (that is where you call it from), while "pbcopy" copies std-in (what you put there) to the clipboard. An important quirk is that they only handle plain text, RTF and EPS, that is formats that are transferred as plain text. This is because unix is a text based system. What it means is that you can't copy stuff from formatted text, e.g. word, but with spreadsheets you are OK.

As command line programs they can be handled through the R command: pipe(). Pipe does not produce the current clipboard contents, just a description of the pipe as such. You have to use a read command to get the actual contents.
> readLines(pipe("pbpaste"))
which will produce one string per line (completely useless as data, but often useful to see how a given copy is formatted). To format it for data you use the same as you would any import, using one of the higher level read-commands: read.table(), read.csv(), etc.
> x <- read.table(pipe("pbpaste"))
This will put your copied excel table directly into the table "x" in R. Often you will be forced to tweak the function a little to get a usable table.
> x <- read.table(pipe("pbpaste"), header=TRUE, sep="\t")
That should be able to read your copied Excel data ("header" specifies that the first row is the header, and "sep" specifies the separator which defaults to tab or "\t" in excel).

To write to the clipboard you use "pbcopy". It is a bit more involved, but not much. First you connect a variable to the pipe from pbcopy.
> osxclipboard <- pipe("pbcopy", "w")
Now you can write to the variable "osxclipboard" and it will turn up on the clipboard so that you can paste it into another application. You have to remember that it is a pipe to an external file, which means that you have to use "write()" to put data in the clipboard. If you just assign some data to "osxclipboard" it will be changed from a pipe to that data. Thus:
> write(x, file="osxclipboard")
where "x" is your data, will to the trick. Then you just have to clean up using:
> close(osxclipboard)
In the same way as with copying from the clipboard, this will not format your data optimally. so you have to add some formatting command for Excel to read it properly.
> write(x, file="osxclipboard", sep = "\t")
There we are, but that is rather alot of code. Not really that much easier than a regular export from excel and then import to R. So here are two simple functions to do it all at once, with the most used arguments (I'm sorry for the code, I haven't figured out how to get indenting to work properly in blogger).

Simple readlines from the clipboard:
clipboard.readlines <- function (
clipboardname = "pbpaste",
n = -1L) {
readLines(con = pipe(clipboardname),
n = n)}
Read table from the clipboard. I have only included the most commonly used arguments to read.table(). You could easily add all the rest if you need them:
clipboard.readtable <- function (
clipboardname = "pbpaste",
header = FALSE,
sep = "",
quote = "\"'",
dec = ".") {
read.table(file = pipe(clipboardname),
header = header,
sep = sep,
quote = quote,
dec = dec)}
Write to the clipboard:
clipboard.write <- function (x,
clipboardname = "pbcopy",
sep = " ") {
osxclipboard <- pipe(clipboardname, "w")
write(x = x,
file = clipboard,
sep = sep)
Close(osxclipboard)}
That was it for now. I hope someone finds it helpful. I'm probably not putting any of this into a formal extension, so you will just have to run the code to use it. Consider the code GPL-licensed, although the text is under regular copyright.

Monday, July 18, 2011

MD or PhD

Let us return to the discussion about combining research and clinical work. Specifically starting a new group in a physiology lab and working as a junior doctor at a university hospital.

I have now finished my first spat of full time research in the new lab after a year as a clinician. I have been able to do most of what I set out to do this semester, but I will probably have to work as much next spat of research to make it work then too. The reason for this is that none of the senior PIs are directly behind my project, therefore none of them thinks that I should encroach on their space. At the same time they are all very supportive and positive to me being there. Just in a more theoretical way. What will happen is that in a year or two (hopefully sooner), there will have to be a centrally controlled reallocation of the lab space at the department, until then I will probably have to continue on borrowed space.

Funding wise, it is going alright. With a couple of minor grants I have had enough production of preliminary data to be able to apply for some real grants. Career wise, the next step will be a docenture, which is kind of like the Swedish version of tenure. You need a number of original publications and you need to show that you are independent as a scientist. On top of that you have to have taught a minimum number of classes. In combination with clinical work it is a chore to get it all done as quickly as possible, but nothing much happens until it is done.

Clinically I have spent the first year in medicine, which is my home field, so that has been good. Now I am going to rotate out into psychiatry and surgery this autumn, and while that may be interesting and possibly good for something, it is also a bit of a waste. Especially as I am just picking up speed in the lab again after moving back to Sweden. I know, it was my choice to try to combine the clinic with research and rotation is a necessary part of a junior doctor's life, but I can still complain. There is surprisingly little time over when working clinically, but I hope to spend the autumn revising and submitting some new and exciting manuscripts, and writing even more grants.

But now for my last week of vacation.

Tuesday, July 05, 2011

Advice for a Young Investigator

Santiago Ramón y Cajal was a 19th century neurophysiologist. I'm told he is well known, though he seems to have ignored the kidneys completely. Strange.

Any way, he wrote a book - "Reglas y consejos sobre investigacion cientifica" translated as "Advice for a Young Investigator" - to help budding scientists through their first years as researchers. While some of his advice is dated, such as the section on how to choose a wife, most is well worth the $14. What follows is a brief summary and some comments on the 1999 MIT Press pocket edition (with one of the worst quality bindings in modern history), translated by Swanson and Swanson (who have done a good job).

There is a Foreword by Larry W. Swanson with a short biography of Dr. Cajal and some suggested readings from his quite large production. Then there are three prefaces, for each of the second, third and fourth editions.

There are nine chapters, each addressing a different potential difficulty.

1. Introduction
The introduction concerns itself with which theory of science a scientist should build his understanding of nature upon. The answer is determinism. Cajal is very clear that a scientist should not spend his time delving too deeply into the various theories of knowledge and science. He writes:
"...by abandoning the ethereal realm of philosophical principles and abstract methods we can descend to the solid ground of experimental science..."
In this he comes quite close to my own thoughts on the matter (which may be why I like the book in the first place). Today, pure determinism is still usefully utilized in Chaos Theory, or the study of non-linear dynamics, but in general the focus today should be on statistical determinism. That is, the fact that we cannot know the full state of any system (at least any interesting system) induces variation and that this punches a quite large hole in classical determinism, but can be compensated for by studying larger populations and using statistics. Actually Cajal does not mention statistics at all, probably because it was just starting out as a field at the time.

2. Beginner's Traps
In the second chapter Cajal goes through some things that might unduly discourage the beginning scientist from his chosen path. Basically that well known feeling that those who went before were smarter, saw farther and thought deeper than you ever could. He makes the case that it only seems so after the fact, and that with hard work and time a scientist starting out today will appear equally daunting to those starting out in the future.

3. Intellectual Qualities
Cajal's main point about the mind of the investigator is that it does not have to be exceedingly brilliant as long as it is tenacious and a bit vain. He does mention originality, but his focus really is on hard work and the striving for glory. These are qualities he dejectedly notes are none too present in his contemporary Spaniards, while he holds the Germans in high regard. He writes:
"In Spain, where laziness is a religion rather than a vice, there is little appreciation for how the ... work of German [scientists] is accomplished - espeially when it would appear that the time required ... might involve decades!"
Rather poignantly, the endnotes have been expanded with the editions. In relation to a section written in the original 1893 edition Cajal later notes:
"This frank optimism is now greatly undermined by the hideous international war that began in 1914... It is sad to admit, but all nations become ferociously imperialistic as soon as possible... So much for the weak and unpatriotic!"
4. What Newcomers to Biological Research Should Know
In this chapter Cajal handles the opposing needs for the investigator to know a lot about disparate fields, especially the basic sciences, and at the same time specialize as much as possible to be able to produce original work.

Perhaps his most important point is the short section on "Mastery of Technique", as he writes:
"...the most important scientific conquests have been won by only a dozen men who have become known for their invention of improvement of a research method..."
5. Diseases of the Will
This is clearly the most entertaining section. The six most dangerous personalities - "who never produce any original work and almost never write anything." - are described in detail. I will only quote the his classification, the rest you should read in his original, quite wonderful prose.
"These illustrious failures may be classified in the following way: the dilettantes of contemplators; the erudite or bibliophiles; the instrument addicts; the megalomaniacs; the misfits; and the theory builders."
While these are quite fun, and you can always find some colleague that fits each personality, the more important lesson is that everyone gets trapped in these mires of the mind from time to time. The important thing is to realise that you are stuck in an unproductive mindset and be able to move on.

6. Social Factors Beneficial to Scientific Work
These are the ever current problems of funding, combining a profession with science and combining work and family. His basic stance is that you can always do science, but you should be ready to sacrifice having a life. Good advice.

7. Stages of Scientific Research
Here Cajal goes over the practicalities of the experimental method. Observation - Experimentation - Working hypotheses - and Proof. It is material gone over many times in other books, although Cajal has the benefit of being brief.

8. On Writing Scientific Papers
To start with Cajal references a Mr. Billings and states four rules: Have something to say; Say it; and Stop once it is said. The fourth rule wasn't as catchy so I'll just drop it. Then he writes a bit about credit and curtesy.

9. The Investigator as Teacher
The final chapter expounds on the importance of fostering future researchers to continue the work once you have gone. He concedes that it might be restful and rewarding to work in solitude but that "Posterity has always been generous with the founders of schools." He then goes on to describe the pains and pleasures of trying to combine research and teaching. First, how to find a suitable potential investigator; then how to guide him; and finally how to see him become a successful scientist leave science for profit and glory.

In conclusion, it is one of the few books that actually describes what it means to be a scientist, specifically a physiologist. It is certainly one of the very, very few that does so while being well written. I heartily recommend it to all my colleagues, and to any one else who might be interested in what science really is.

Monday, June 06, 2011

When is the evidence good enough?

Saturday Morning Breakfast Cereal is the name of a web-comic that is just about as good as xkcd, and they pose some very intimidating questions.


Anecdotal evidence is popular in medicine. Obviously it's not called that. It's called a "case report" or an "observational study". Basically you see a number of patients and then you pick one that supports some notion you have and put it on a pedestal. Another manner of doing it is to collect a number of these cases and call them a case-series. The next level is to collect all your cases and dig around until you find some common feature in all of them or in a sub-population. Finally you get to the level of looking at all people with a certain condition, usually nationality and some disease, and then you can call it "epidemiology". The problem with all of these designs is that if you look hard enough you can find something interesting-looking in any collection of data. This is especially true if you don't care what you are looking for.

The next level of scientific quality is to care what you are looking for from the beginning. This means you pick a group of people and say that, for example: "I believe those with higher blood pressure now will die sooner than those with lower", and then you wait. After some time, in the best case a predetermined time, you check how many have died and draw your conclusions. Such a conclusion might be that high blood pressure is a risk factor for death. This is not necessarily such a bad way of doing science. The problem is that then you start muddling through your data to look for a reason for the difference in death rates, and then you are suddenly producing anecdotal evidence again.

The highest level of evidence is not to use a found population with some difference, but to use a homogenous population and induce a change in some of them while comparing them to the rest. This is experimental science and it is the only way to show causal relationships. You still have to preconceive what you are looking for, otherwise you are still just muddling through the data looking for differences. This means that an experimental study is only valid as such for the question it was designed to answer. If you take the population in an experimental study and look at something else then you are back to doing an observational study, producing anecdotal evidence.

So, what is the problem? Anecdotal evidence often turns out to be correct. This is how much science comes about; you have an anecdote (say a case study, or some epidemiological finding, or a post-hoc analysis of an experimental study) that leads you to a hypothesis. Then you test the hypothesis with an experimental study to see if it holds up. Easy. This is how it is supposed to be. The problem is that anecdotal evidence is often taken for true directly (by the media, policy makers and the public at large), without further testing, and the later experimental evidence does not get the same attention even though the science is better.

For scientists this is not as big a problem as for the public. By following the field you learn what questions are being asked and which study was designed to answer which question. With clinical trials this is solved today by publication of the protocol and hypothesis before the study starts. Pre-clinical papers on the other hand are mostly experimental in nature, but they are often written so that it is not clear if the conclusion is based on the original question or if it is something the authors picked up on the way. This is because there is not enough space to tell the story as it happened, and that it frankly wouldn't be that good a read. The principle is that you take what you have and write the best story possible. That's how to get published. What it also means is that, unless you know the investigators and what their main focus is, you don't know if the study was a preconceived experimental study or a post-hoc study.

Getting know the investigators in your field means going to a lot of conferences and listening to a lot of talks. That's when it is a good thing to have some online comics to fall back to. Because falling asleep is embarrassing.

Sunday, June 05, 2011

Conspiracy against science

This is a warning to all scientists out there (and anyone else who has too much control over their working hours). Stay away from Minecraft! I first found out about it through the online comic xkcd that published an excellent strip about policy makers, the media and science, or as I like to call it: Stay away from the green jelly beans!

Since I always do what xkcd tells me to. I immediatly tested the old version of Minecraft, which is free, and then bought the beta. Yes, it's still in beta and yet they have over two million paying users.

The home page describes it as:
"Minecraft is a game about placing blocks to build anything you can imagine. At night monsters come out, make sure to build a shelter before that happens."
Which describes the pretty well. Depending on your imagination and persistence you can build anything, it's like LEGO that way. You can either go the drug-induced but orderly xkcd-way, or you can go all out crazy and build a scale model of the USS Enterprise (that's United federation of planets Star Ship Enterprise in case you thought anything else). The other way to go in the SF - Fantasy spectrum would be a recreation of Tolkien's Middle Earth, but no one could be that crazy, or could they?

The alternative is to play the survival mode, where monsters come at night. It starts all peaceful with sheep and cows milling around in a serene, sun-lit landscape. Then the sun goes down leaving the world pitch dark, and then the monsters come. First you hear the clacking of bones, or the groaning of zombies, and then you die. If you know this you build a house and light it with torches before night comes, then you are safe.

By the way, parents of small children don't always appreciate your explaining this aspect of the game to their children. Apparently it makes them afraid of the dark, or makes them excitedly tell their younger siblings that the monsters come at night, which amounts to the same thing.

So, that's about it.

Man modestly mines minerals.
Moonlight marks midnight.
Man-eating monster mangles.
Mutinously mutes machine.
Mired mind must muster motion.
Meets miserable methods-mountain.
Meekly manages more Minecraft