Showing posts with label research. Show all posts

Saturday, March 07, 2015

Meta analysis in R

or 

the beneficial effect of teaching on research

I have been fascinated by meta analysis for a long time. It is so obviously the right way to approach the true effect of an intervention. Recently, an old binder presented itself in a pile of shite bunch papers I meant to read but found myself throwing in the bin tidying away. It contained the draft of a database of physiological data from the first years of my PhD. The idea was to compare all the baseline data from our kidney research group in Uppsala to look at the effect of the models as such and the interventions that were used repeatedly. With the insight of the intervening years it seems a lot less interesting now, but I still have the feeling that some areas of experimental research could benefit from meta analysis.

Which brings us to the the story I am about to tell. Four or five years ago, when I moved back to Uppsala, I got offered a lecture on physiological changes in the elderly. It was to be part of a final year course for the master in biomedicine programme. Just a single hour to show how all the physiology from the rest of the programme changed with age. To compare and contrast ageing as such with the accrued ailments of living for a long time, and distinguish these from the chronic and age related disease. It was not a huge success, but given the title I was not too disillusioned. The second year I was given two hours. Still a bit on the short side, but one hundred percent better than one.

It is not the most popular lecture, but I have had it for five years now and one of the things I teach is that some parts of ageing is caused by metabolism itself. The burning of oxygen singes the organism and with time it will break much like the paneling in an old sauna. As proof of this I used the idea of caloric restriction, which can prolong life in many strains of yeast, mice, and rats. Then, in 2012 an article was published on the effect of caloric restriction in the Rhesus monkey, a primate, and reasonably the closest relative to humans in which an experiment could be expected to be finished any time soon. It showed no effect. I happily included this in my lecture as a counter-point. Until in 2014, when updating the lecture for a new semester, I found that another experiment with caloric restriction in Rhesus monkeys had published their data and found a clear difference.

This made it hard to continue the lecture as I had done, I could just show both studies and say that we don't know. But the total number of animals included was quite large, and the effect measure very straight-forward. Death. So, I performed a meta analysis of mortality of these two studies, and a third smaller study published in 2003. This is the story of that analysis.

Quickly I installed the R package rmeta by Thomas Lumley and set to work. It is quite easy really, we start with setting up a table of results from the included studies. The table should include the total number of subjects in each group, and the number of deaths per group.

Hultström, M. Acta Physiol (Oxf). 2015 Feb 14. doi: 10.1111/apha.12468.
The we push this trough the rmeta function meta.MH(). To get a forest plot, we just run the plot() command, which has a default for handling the result of meta.MH() in the form of a forest plot. If you have a larger meta analysis there is also the funnelplot() that can be used to assess publication bias. Anyway, the result is quick and easily understood, which is really one of the major strengths of the forest plot.

Hultström, M. Acta Physiol (Oxf). 2015 Feb 14. doi: 10.1111/apha.12468.
There was no significant effect of caloric restriction on all cause mortality in Rhesus monkeys. Or, rather there was a small, clearly non-significant, effect. One of the reviewers asked what would be needed to show if this effect was true. That is, could I please perform a power analysis. So, I installed the pwr package and ran a 2p2n.test() using the most generous effect estimate, i.e. a hypothetical study that ran to completion where the whole control population had died giving an effect of 0.08. This resulted in a required population of 2806 subjects to reach 85% power. This is the power-level which is normally used as the basis for power calculation in clinical studies. However, the age-related mortality was a different story that you can find in the actual article.

The next thing that surprised me was how difficult it was to get this simple little analysis published. It appears that experimental journals don't publish meta analyses, and clinical journals that publish meta analyses, don't publish experimental results. Finally, I found a benevolent editor at Acta Physiologica who permitted it to be published as an editorial. So that is where it resides today, and finally I can give a fairly clear answer in my lecture on the effect of reducing metabolism by caloric restriction on ageing and on mortality. Only problem is, I now have to explain meta analysis and forest plots before I can show the actual data.

And, no I am not going to starve myself so that I can avoid some diseases we can treat in favour for a frailty for which the only known treatment is eating more.

Wednesday, November 26, 2014

Tag clouds in R

An easy way to visualise the concepts that are important in a text is to create a tag-cloud where the most common words are written large and less common words are made smaller and smaller. We want to remove the really common words first so that we avoid creating a cloud with only "in", "of", "for", "the", "a", "an", and so on. There are a number of web-based applications that will do it for us, but where is the fun in that when we can do it in R?

The first question is which words to use. It boils down to finding a suitable text that really reflects the research. The best I have come up with is using article titles. First we copy all the article titles into a single file, and then we rearrange them so that there is a single word on each line. This makes it easy to import into R as a matrix using:

> ArticleTitles = as.matrix(read.csv("file-with-title-words.txt"))

The "as.matrix()" is needed since read.csv automatically imports files as data frames, while the package we are going to use accepts only matrixes. The package in question is wordcloud, which we get it by running the following code at the R-prompt:

> install.packages(c("wordcloud", "tm"))

and loading them with:

> library(wordcloud)
> library(tm)

Thereafter it is as easy as:

> wordcloud(ArticleTitles)

As the default this produces a cloud of up to 300 words that appear a minimum of 3 times using black text on white background. It removes all punctuation and common words automatically. There are a lot of different parameters that we could fudge to get a better-looking cloud but that is left to the reader to try out. In order to make the cloud look like a kidney we can just run the code a number of times until something vaguely kidney-like appears, and then import the image to Adobe Illustrator to make it even better. Finally a light gray outline of a kidney is introduced as background to make the shape more obvious. 

Friday, July 12, 2013

Climbing to the top - Kidney Camp 2013

"Kidney" CAMP!

The FASEB Science Research Conference on "Renal Hemodynamics: Integrating with the nephron and beyond" took place last week at Vermont Academy in Saxton's River, VT. The meetings were previously called Summer Research Conferences, but they changed that to the quite strange "science research" that sounds more like a branch of philosophy to me.
Anyway, we still call it by its proper name: Summer Kidney Camp. It is a summer camp where spouses send their kidney physiologist halves to wear them out and enable at least a semblance of normal conversation during the rest of the summer. I'm guessing that doesn't work out as well as they hoped in much the same way as summer camp for kids don't.
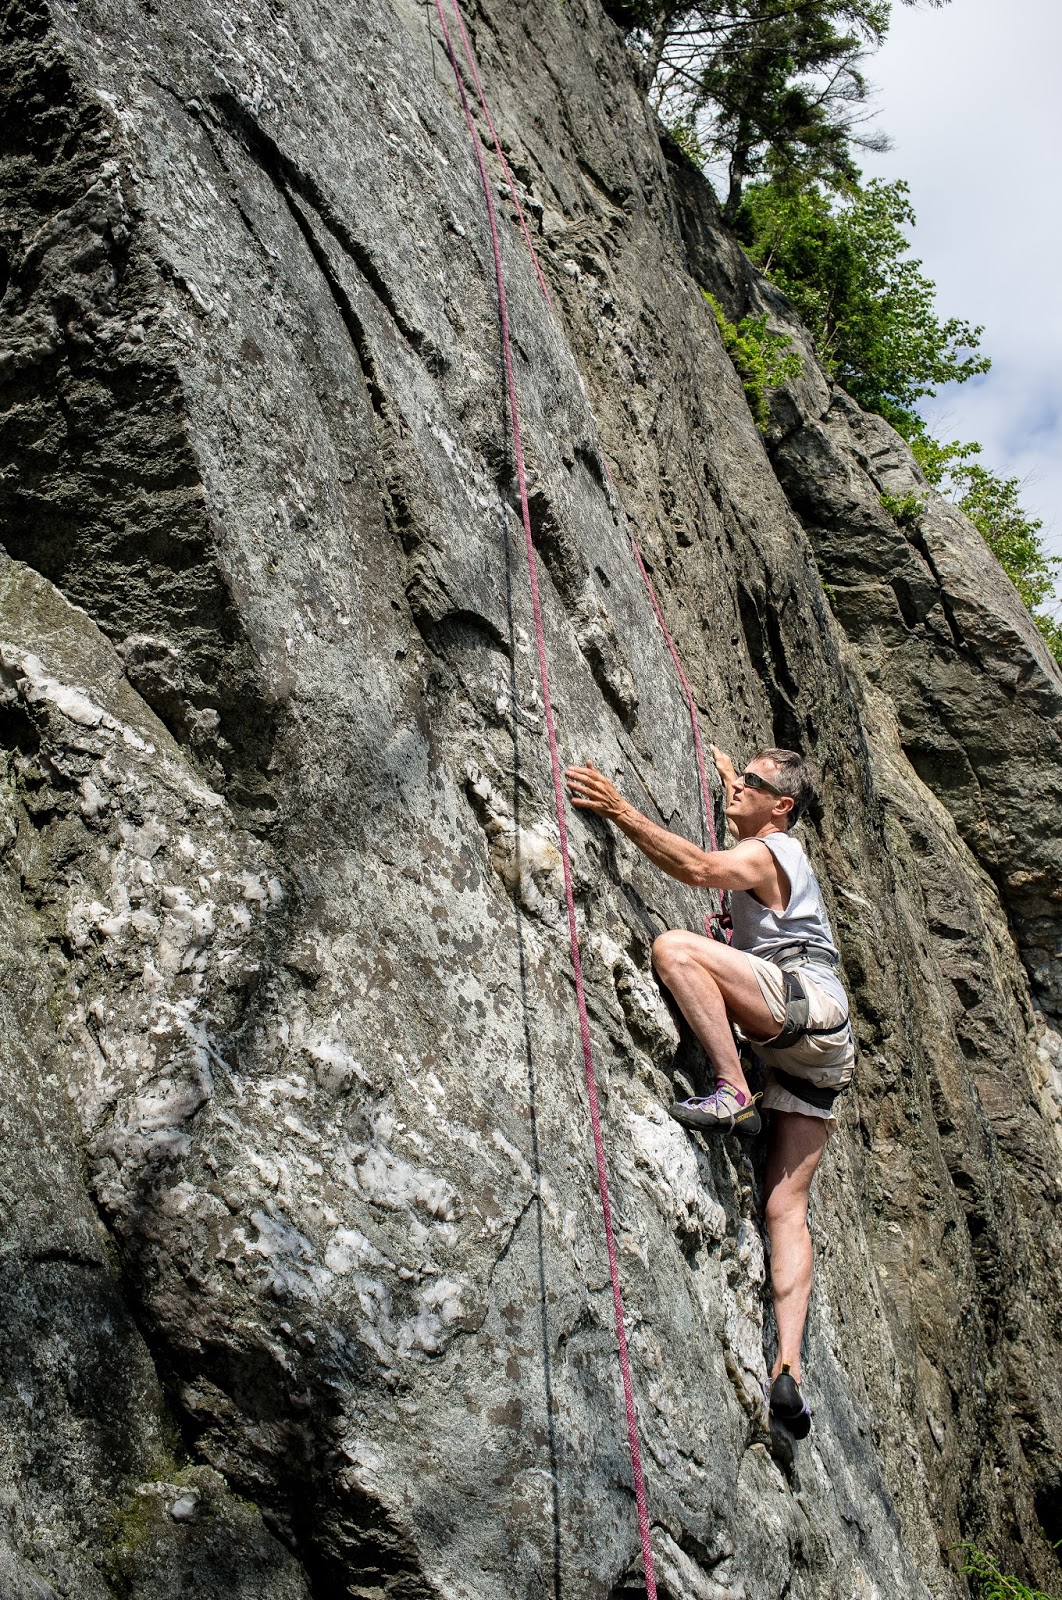
The Kidney Camp is held every three years, and has a tendency to return to Saxton's River, even if it has been held in other locations once or twice. The main feature is the afternoon-break where we do important sciency stuff, like sitting in the grass, playing softball, football (proper football), basketball, and top rope climbing (which, by the way, is awesome). As far as I can tell most attendees only play sports once every three years for reasons unknown to science, and quite dangerous to be honest. The climbing was probably the safest activity.
The evenings are filled with more science. The fiercely competitive talent show, which was won by one of the supporting acts. The collaborative table tennis, and the very novel fussball table (rumor has it the last one broke three years ago) where any argument can be settled with a well timed spinning of the rods.
Then we have billiards, which makes you look better, but only until you pop the cue-ball off the table. Aaron, who is posing for illustrative purposes only, never did. I promise. Honestly.
In between these important scientific sessions there were some other stuff, where a lot of actual science was actually discussed. Some six to eight hours of lectures per day, and the best poster session in the field. Not only because it is the poster session with a bar that serves local micro-brewery beer, but also because the bar keeps people at the posters and everyone, even invited speakers, bring posters. Luckily it is three years to the next meeting so that I, and my liver, can recover.

Thursday, May 16, 2013

Patientsäkerheten kräver att alla data från kliniska prövningar publiceras

Öppet brev till de svenska Europaparlametariker som sitter i gruppen för Miljö, hälsa och livsmedelssäkerhet.
Kära Carl, Åsa, Christofer, Marit och Marita,
Jag skriver till er eftersom ni är med i Europeiska parlamentets grupp för miljö, hälsa och livsmedel som arbetar med frågan om publicering av data från kliniska prövningar. Jag är läkare och arbetar som ST-läkare i anestesiologi och intensivvård vid Akademiska sjukhuset i Uppsala och driver en forskargrupp som arbetar med högt blodtryck och akut njursvikt vid Uppsala universitet.  
Det är av yttersta vikt att alla kliniska prövningar publiceras, och att alla data från kliniska prövningar finns tillgängliga för metaanalys och jämförande forskning. Som medlemmar i Europeiska parlamentet har ni en unik möjlighet att föra den evidensbaserade medicinen ett stort steg framåt. Idag publiceras inte alla prövningar och bakomliggande data tillhandahålls inte för metaanalys av oberoende forskare.
Detta är oacceptabelt från ett patientsäkerhetsperspektiv eftersom läkare kan föreslå suboptimala eller rent av felaktiga behandlingar om de inte har tillgång till all information. 
Det försämrar europas möjlighet för forskning och utveckling genom att forskare i onödan gör om prövningar som redan gjorts bara för att de aldrig publicerats.
De patienter som ställt sig till förfogande för forskningen har en förväntan att deras uppoffring skall leda medicinen framåt. Genom att tillåta att data från kliniska prövningar undanhålls bryts patienternas förtroende för den kliniska forskningen. 
Publiceringskravet bör gälla alla kliniska prövningar för alla mediciner som säljs, oavsett om dessa är nya prövningar eller tidigare prövningar som aldrig publicerats. Om gamla prövningar tillåts förbli opublicerade kommer fortfarande majoriteten av de mediciner som används idag att ha okompletta data. 
Ni kan hitta mycket mer information på sidan http://alltrials.net. 
Tack för att ni tog er tid att läsa detta och för att ni ställer er på patienternas, medicinens och forskningens sida i denna avgörande fråga för den framtida folkhälsan och medicinska utvecklingen.  
Vänligen, 
Michael
Ni som läser detta kan också skriva till era EU-parlamentariker. Deras e-postadresser hittas på http://www.europarl.europa.eu/committees/en/envi/members.html#menuzone 

Monday, February 11, 2013

Winter-meeting in Oslo

The Norwegian Hypertension Society held its bi-annual scientific meeting in Oslo last week. It was a long time in planning. We set the place and date about two years ago. Sent the first announcement in the spring of 2012 and the call for abstracts in September. Then, at the very deadline, the abstracts and registrations start to trickle in. As with all meetings, we pushed the submission-deadline back a week just to allow people without basic planning skills with pressed schedules to join the meeting and present their data. Then, in as little time as possible, all the abstracts have to be formatted into a program, and session-chairs has to be found and matched so that they have an interest but aren't speaking themselves.

Anyway, we got some 17 free communications, varying from experimental physiology to international research politics, but with a heavy focus on epidemiology and clinical research. There were a couple of talks on the recently very hot topic of renal sympathetic denervation for treatment-resistant hypertension (more on that in another post), some interesting sub-group analyses from the LIFE and SCAST studies, and follow-ups on the now 40-year-old Oslo-Ischemia-Study. More of the program at the society home-page.
In addition, we had two invited lectures on statistics in clinical research. The first on how to develop and validate prognostic models by Ingar Holme, and the second on over-adjustment bias in multiple regression models held by Knut Liestøl. It was a useful repetition of the uses and pitfalls of these two very similar kinds of models that require very different study-designs and give very different information in the end. A common problem is that one tries to get etiological information from prognostic research, i.e. treating a risk-factor as a cause for the chosen end-point even though the observational design makes that impossible. The converse is equally common, i.e. trying to infer prognostic information from etiological studies, such as clinical trials, where the highly selected population makes general conclusions very suspect.

All told, it was a very successful meeting, well worth the time both for planning it, and attending.

Tuesday, October 16, 2012

Hemodynamic Mechanisms of Acute Kidney Injury


Last week I was at an Acta Physiologica Symposium in Copenhagen. It was a scientific meeting jointly financed by the Scandinavian Physiological Society through the European journal Acta Physiologica, previously Acta Physiologica Scandinavica, and the German Science Council. As far as I have understood the first meeting they have ever financed outside of Germany.

From my perspective it was brilliant, there were at least six of my collaborators there and we got some time to discuss our future plans. Admittedly, not much time, but face-time is worth immensely much more than any number of mails and phone calls.

We were at the very worthy Royal Danish Academy of Science located in an old building right across from Tivoli in Copenhagen, just behind the city hall. It's from a time when there was money for science, and when that money wasn't unnecessarily spent on research. Marble, marble, marble, huge oil-paintings, relief-ceilings with paintings.


The actual meeting was about the hemodynamic mechanisms of acute kidney injury, which is a very current topic indeed. We are just about closing in on a time when we will be able to detect kidney injury already in the A&E, before the advent of renal failure with cessation of filtration. This means we will need to be able to distinguish different kinds of kidney diseases and will be able to follow treatment much more closely. What it means is that not only will we have to understand the early progression of kidney injury much better, we also need to find new, quick ways of defining it. It's going to be lots of fun. Look for the proceedings in the March or April issue of Acta Physiologica.

Sunday, October 14, 2012

That third reviewer and the quality of your research

An interesting piece of meta-research has been circulating recently: Papers that have been refused and resubmitted receive more citations than papers that are accepted as is. This may appear counterintuitive or self-evident depending on your point of view.

It appears counterintuitive for non-scientists because it is easy to think that most of what gets refused is low-quality research. However, I would posit that authors are actually quite good at picking the right journal for their work, and get refused for other reasons than the over all scientific quality. This is where it seems self-evident. If authors are good at picking journals, then papers get refused because of insufficient supporting data. If, in addition, the quality is good this means that the reviewers find the results highly interesting. So interesting in fact that they would like more data to be really certain that the conclusions are correct.

This would certainly fit with the result of Calcagno and co-workers' findings that these previously refused articles are more highly cited. On top of that, a refusal generally includes reviewer comments and suggestions that pin-point the weaknesses of the work as seen from the outside. This often means that the authors will add even more data before resubmitting, and may then choose a higher impact journal as was indicated by the finding that the highest impact journals actually were more likely to accept articles that had been rejected elsewhere first.

There is of course still the possibility that the third reviewer is being an ass.

Thursday, June 21, 2012

Analysis of genome-scale data

I thought I should do a post on strategies for handling genome-scale data from large experiments. Like many happy novices we rushed in and performed a couple of huge microarray experiments. Now we are trying to compare these against eachother and against strain-differences in in the form of SNPs. To say that this is not trivial is an understatement. In the end we have come up with a couple of strategies that might be useful to others as well. They might seem simple, but they will help you wade through your data, without getting stuck there for too long.

Don't look at untested data for anything but quality control. In most analysis programs it is very easy to just plot a gene by its intensity, either over all samples or by crude difference between group-averages. This is fun, and can give you some idea of what you are looking for. However, there are anything from 20k-30k genes in your dataset and you will not have time to look at all of them and make a reasoned decision. That means that if you pick genes this way you will indeed pick some hits, but not in a systematic way, and that leaves you open to errors. Either of picking a gene where the variation is too large, or that may only be the n+100th gene in your set and not the top one. The point is: You just don't know. The suggestion is to test your genes first, and then use the list of significantly differentially expressed genes to pick your top hits.

Consider doing a single comparison across several groups. If you have run a large experiment, with several groups (where several is anything from four to whatever). It is a chore to keep track of which genes were significant in which comparison, and even more to then pick a small number of genes to validate that are somehow representative across groups. So, try to pool your data by phenotype. If you have one group where something happens and lots of different controls. Just pool the controls and do a single comparison. That will give you just one list and make your selection process much easier.

When comparing experiments, use rankings. So, now you have a list, or several if pooling didn't make sense. Now you have to find your top candidates for validation. It is then helpful to use rankings. The easiest (and often quite accurate) way is to rank by average difference between groups (that would be your fold-change or log-ratio). If you have just one list, then you are done. If you have two, or several lists, then you can order your lists by rank-sum or rank-product. The rank-sum is a kind method that gives you some hits even if a gene is poorly-ranked (high number) in one of your groups. The rank product will pronounce those that are highly-ranked in all lists. Then you have the very particular rank-difference and rank-ratio. These may be very interesting if you have two experiments with wildly different phenotypes, but that you can not compare directly. If a gene is ranked in the top 10 in one experiment and 7815th in the other, it may be a very interesting gene and will then be ranked highly by the rank-difference or ratio.

Sunday, December 11, 2011

How many hits do you want?

Data mining is a huge business today and also an area of intense investigation. After an intense week of trying to compare gene-expressionmicroarray data from different experiments during my recent spout in Glasgow, I thought I would share some thoughts on analysis methods. Basically the choice comes down to the number of hits you might want, which in-turn is decided by how you intend to analyse and validate your results.

With modern high-throughput methods one of the main problems is choosing candidates for validation and further study. As long as you are just doing PCRs for validation, you can run quite a number, but proper validation will often require knock-out, and/or knock-in experiments, possibly both in-vivo and in-vitro. Picking the wrong candidate can cost you years of work. So, you had better be correct when you make your decision. This is a reason that it is common to filter high-throughput data by the size of change. Whether that is advisable depends on what you want to do with the data. Modern high-level data analysis often works much better if you have more to work with. Not to mention that many of the new methods of analysis are designed to look for systems of changes, each of which may be negligible, that together may cause significant physiological effects.

The calculation of a p-value comes in two steps. First you calculate a value and then you correct that value for multiple comparisons.
  • Anova: Mathematically elegant but computationally heavy and quite strict, producing not so many significant hits. It also depends on there being similar variations and similar number of samples per group.
  • Rank product: Basically ranks each gene in each sample multiply these across samples and compares the results to similar products from randomly generated datasets. Of all the heavy methods this is one of the heavier. i.e. long computations times.
  • Empirical Bayesian methods: I won't say I understand what exactly this does, but it is described as "reducing the standard error toward a common mean." This means that you are in the end comparing the estimates of the means of your samples, i.e. a variant of Student's T-test, but one that somehow takes the rest of your expression data into account. This is a quick method that is also well regarded.
  • T-test: Your favourite statistical test, seldom used by itself in microarrays, se SAM for more details.
  • SAM: Significance Analysis of Microarrays, using T-tests to test the contrast of interest and compare it to other permutations of the samples. If the contrast of interest shows a better significance (by a set level) than the random configurations then it is deemed significant. Depending on the number of permutations you use the analysis is more or less computationally heavy, but it does by necessity take quite a bit of processing.
  • Signal to noise ratio: You basically divide the the mean (difference in mean) by the standard deviation. This in itself does not produce a P-value, but it does provide a way to rank genes that can be used to pick the most probably changed genes. If you compare the list you get to lists produced by random permutations of your data, then you can produce proper p-values, but that makes it more onerous.
Once you have your p-values, they have to be corrected for the number of comparisons. The thing is that if you use a probability of chance difference cut-off of 5%, as is common, fully 1/20th of your significant genes are probably false-positives.

When correcting your p-values the first important distinction (that many are not aware of) is post-hoc versus à-priori. Mostly these relate to how to test samples after an ANOVA. Post-hoc testing means that you do not know which comparisons you want to make, so you just make them all. 
For example: You want to assess the effect of a treatment on two populations, say men and women. 
This gives rise to four groups: untreated-men, treated-men, untreated-women and treated-women. Or, you may even have before and after measurements in each of these, giving you eight groups. Between four groups there are six (x*(x-1)/2) possible comparisons, and between eight groups there are 28. If you correct your p-value for all these you may introduce a lot of false-negative results, i.e. expression changes that really are there, but that does not make your corrected cut-off. However, many of these comparisons may be nonsensical.

The difference between untreated-men-before-treatment to treated-women-after-treatment, could be one such example. It is difficult to interpret without knowing what the baseline for the women was. What you can do in this kind of situation is decide à-priori (eng. beforehand) to only run some of the comparisons. 
For example: You compare men to women before treatment, before and after treatment only in the same group, the change between before and after only within each sex, and the difference between the changes in the treated and untreated men to the same difference in women*.
This is only eight comparisons out of the possible 28, and some of these would not be included in the 28 at all, i.e. the differences. By cutting the number of comparisons you also cut the correction you have to make to your p-values. In addition, you can argue that the absolute differences are independent from the change caused by treatment and correct these comparisons separately, giving you only a four-fold correction to your p-value instead of a 28-fold. 

Anyway, that was only corrections between groups for one parameter. In a typical microarray experiment you will have 20000 parameters across your groups, so that the total number of comparisons would be 28*20000, or a lot.

Just multiplying your p-values by the number of comparisons was the original and most conservative correction. It is called Bonferroni, because that's the guy who described it. This is generally too conservative and will produce false-negatives even in experiments with a small number of comparisons. However, it is useful for narrowing the number of hits if you think you have too many, or if you need to be really certain of the hits you pick.

The family-wise error rate correction is what ANOVA uses across all samples and it is what post-hoc tests like Tukey's honest significant difference uses for post-hoc testing between individual samples. It is quite strict in large, relatively low signal-to-noise data, like microarrays, but quite relaxed in smaller data-sets. This is difficult to use in à-priori-type designs since these make the estimation of the family-wise variation difficult.

False discovery rate, or FDR, is an iterative correction across a ranked list. Basically, the first hit is uncorrected, the second somewhat corrected and so on. What it is actually saying is that; out of all the genes, from the top of the list to the point you are looking at, a given percentage will be false discoveries. So if you get 3000 with an FDR <0.05 you have 5% or 150 false positives in that sample. This is one of the least strict corrections. It is often used in microarray analysis for that very reason.

The final question is if you correct your FDR values by the number of group-wise comparisons you are doing. Or, maybe you are comparing similar, but independent, experiments, which you could argue strengthens your p-values by as much as p1*p2.

As they say: If it was easy, anyone could do it.

* in this kind of design you should really use a multi-way ANOVA instead of a plain one, and that choice often makes it obvious that you should use à-priori contrasts instead of a post-hoc.

Monday, July 18, 2011

MD or PhD

Let us return to the discussion about combining research and clinical work. Specifically starting a new group in a physiology lab and working as a junior doctor at a university hospital.

I have now finished my first spat of full time research in the new lab after a year as a clinician. I have been able to do most of what I set out to do this semester, but I will probably have to work as much next spat of research to make it work then too. The reason for this is that none of the senior PIs are directly behind my project, therefore none of them thinks that I should encroach on their space. At the same time they are all very supportive and positive to me being there. Just in a more theoretical way. What will happen is that in a year or two (hopefully sooner), there will have to be a centrally controlled reallocation of the lab space at the department, until then I will probably have to continue on borrowed space.

Funding wise, it is going alright. With a couple of minor grants I have had enough production of preliminary data to be able to apply for some real grants. Career wise, the next step will be a docenture, which is kind of like the Swedish version of tenure. You need a number of original publications and you need to show that you are independent as a scientist. On top of that you have to have taught a minimum number of classes. In combination with clinical work it is a chore to get it all done as quickly as possible, but nothing much happens until it is done.

Clinically I have spent the first year in medicine, which is my home field, so that has been good. Now I am going to rotate out into psychiatry and surgery this autumn, and while that may be interesting and possibly good for something, it is also a bit of a waste. Especially as I am just picking up speed in the lab again after moving back to Sweden. I know, it was my choice to try to combine the clinic with research and rotation is a necessary part of a junior doctor's life, but I can still complain. There is surprisingly little time over when working clinically, but I hope to spend the autumn revising and submitting some new and exciting manuscripts, and writing even more grants.

But now for my last week of vacation.

Friday, February 19, 2010

Combining clinical work and basic research

Now I have finished my first week in the clinic. Nephrology paired with a day and a night in the ER. I have managed two brief meetings concerning research, and two evenings in the lab. Having thus prepared for a weekend in the lab, I can say that clinical work and laboratory research is compatible with each other. They are, however, not obviously compatible with life as we know it.

In many ways that goes for all serious hobbies. That is you have time for one serious hobby at the time. While doing full time research I had a fair amount of time to do photography, that involves reading books, looking at photographs, reading blogs, surfing for equipment, playing with photoshop, and occasionally photography. While studying it was ju-jutsu, which invloved rather more practice, but also a fair amount of reading and surfing forums (blogs weren't the thing at the time). Now my hobby is research, it involves quite a bit of reading, blog surfing, writing, some meetings, and occasionally lab work.

Luckily, most of my research at the moment is being run by centralized facilities at the university, which means I only have to prepare my samples and wait. I think analysis and writing is more easily compatible with clinical work, but that remains to be seen.

/M